How do you know that you have a good part during your leak test?
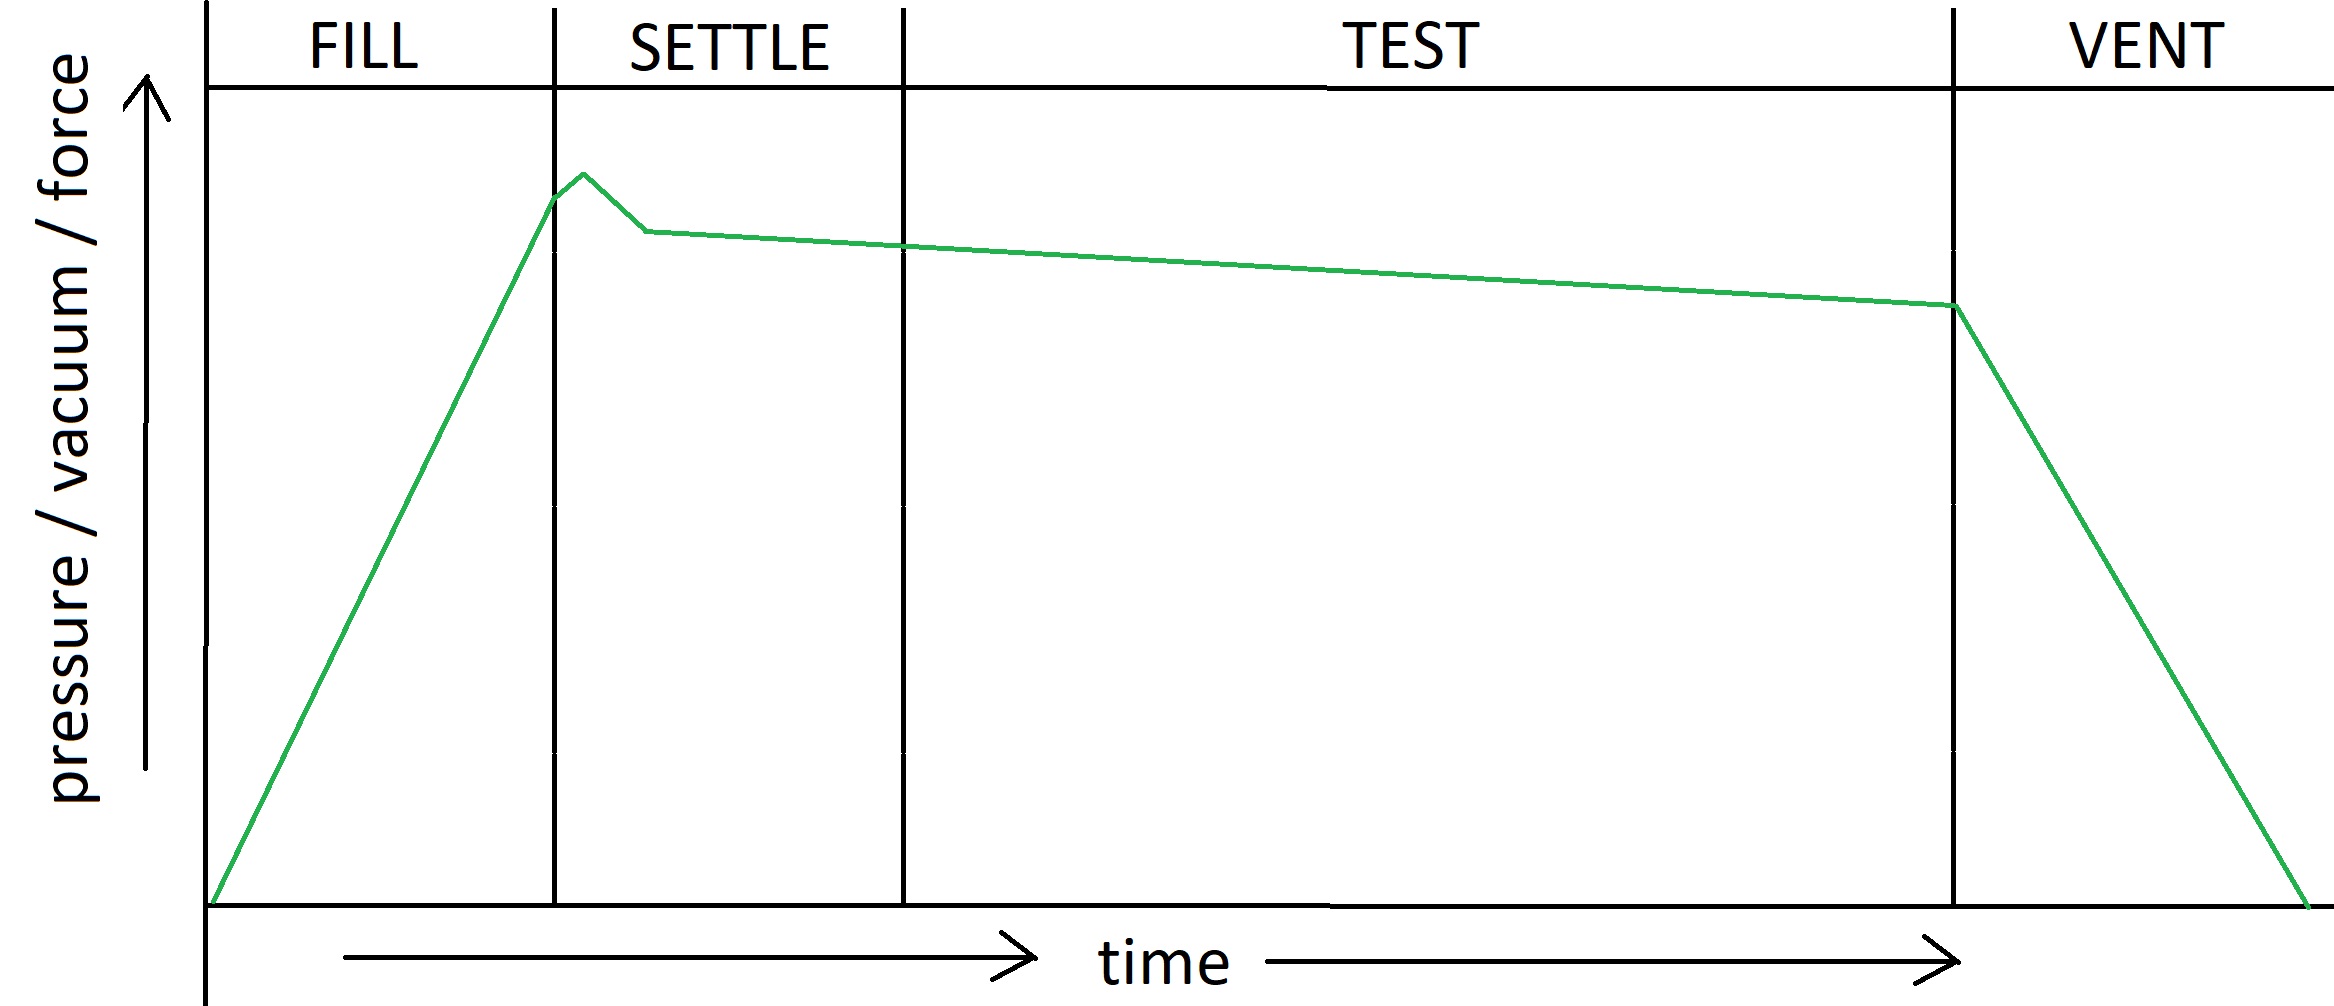
How do you know that you have a good part during your leak test? In order to understand your leak test, you must first understand the Test Decay Curve and what it tells you about your test specimen. There is a certain way that a test specimen behaves during the leak test.
All three Leak Test types, the Pressure Decay Test, The Vacuum Decay Test, and the Force Decay Test consist of the following four main Phases: Fill, Settle, Test, and Vent.
The Curve is represented by two axes, the x-axis which represents the time and the y-axis which represents the signal value of either pressure, vacuum, or force – depending on whether you are conducting a pressure decay, a vacuum decay, or a force decay. The principle is the same.
Fill Phase
During the Fill Phase, the test specimen is inflated by pulling a vacuum or by internally pressurizing the test specimen. The Fill phase starts when the vacuum/pressure valve has been opened and ends when the vacuum/pressure valve is closed.
As the part is filled the pressure/vacuum/force (PVF) signal value will increase dramatically showing a pressure differential between the test specimen and the outside of the test specimen.
The test specimen is tested for gross leaks during this phase.
Settle Phase
The Settle phase starts right after the vacuum/pressure valve has been closed. This phase allows the test specimen to settle. A settling period is necessary to bring the part into equilibrium since the valve is closed. During this stage, you will notice the PVF Signal to behave in interesting ways. Sometimes the PVF Value will increase even though the valve has been closed, that is OK because the test specimen may expand or contract depending on its own construction.
During this phase, very large leaks may be detected. Additionally, anomalies in the specimen material, construction, sealing, physics may also be detected.
Test Phase
During the test phase, the specimen is tested for finer leaks. This phase can last as long as necessary or as specified by the testing protocol. It is also during this Phase that a final PASS or FAIL decision is made on the part.
You will notice that the PVF value will slowly decrease. This is ok because everything leaks, there is no such thing as a perfect seal. However, this Phase can enable you to spot manufacturing deviations if you begin to notice a larger and larger drift on your leak testing specimen.
Generally Speaking if you a performing a pressure decay leak test, the rate of change in pressure over time is measured and if the change is greater than the test protocol setpoint, the part will fail. The same principle is applied to the Vacuum Decay or the Force Decay Leak Test – if the rate of change of the PVF Value is within or smaller than the test setpoint, the part will PASS, if on the other hand, if the rate of change is larger, the test specimen is a FAIL
Vent Phase
After the PASS / FAIL decision has been made, the test is complete and the venting valve is opened and the vacuum inside the vacuum chamber or the internal pressure is released from the testing specimen. The part is released and the test is complete.
The PVF Signal Value will decrease because the part is being vented.
Understanding and Troubleshooting your Test Curve
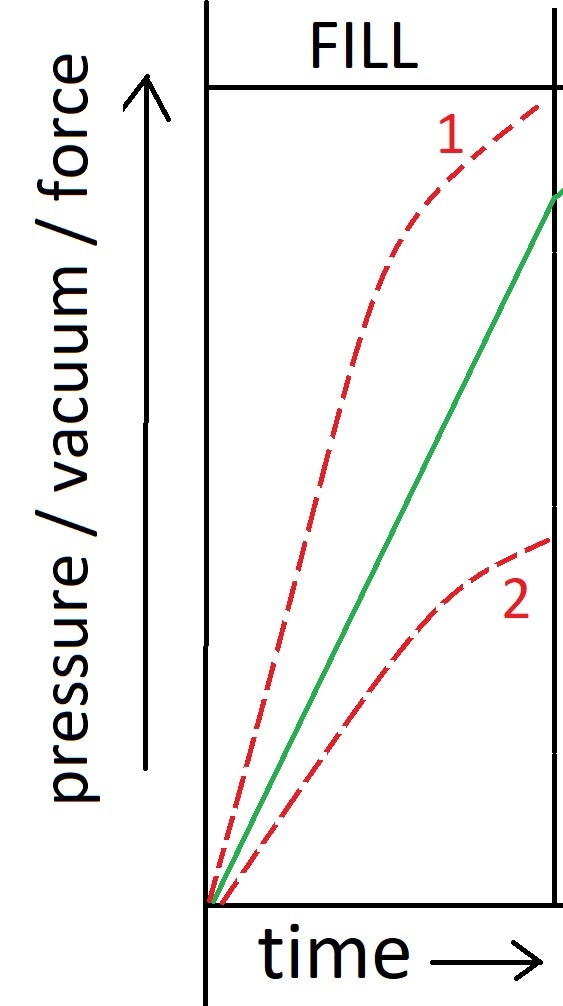
Fill Phase
Good Curve (GREEN)
As you fill your test specimen, the signal increases steadily (solid Green Line). There is always some variation in the slope but it things are within the spec, you should be OK.
Scenario 1: The Filling Slope is Smaller
Most Likely Root Causes:
1. You have a major Gross Leak in your Test Specimen
2. You did not load the test specimen properly
3. You did not connect your test specimen properly
Scenario 2: The Filling Slope is Larger
Most Likely Root Causes:
1. You have loaded the wrong recipe
2. You are testing the wrong part
3. Your Test did not run properly
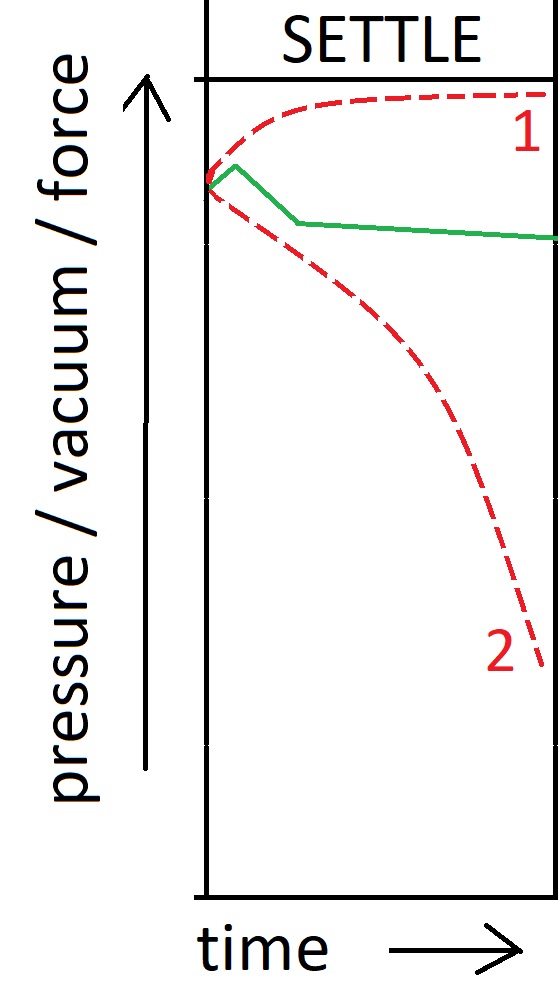
Settle Phase
Good Curve (GREEN)
As your test specimen has been filled to the specified test pressure, the valve will close.
Scenario 1: The Filling Slope is Larger
Most Likely Root Causes:
1. You have loaded the wrong recipe
2. You are testing the wrong part
3. Your Test did not run properly
4. The Testing/filling valve did not close
Scenario 2: The Filling Slope is Smaller
Most Likely Root Causes:
1. You have a major Gross Leak in your Test Specimen
2. You did not load the test specimen properly
3. You did not connect your test specimen properly
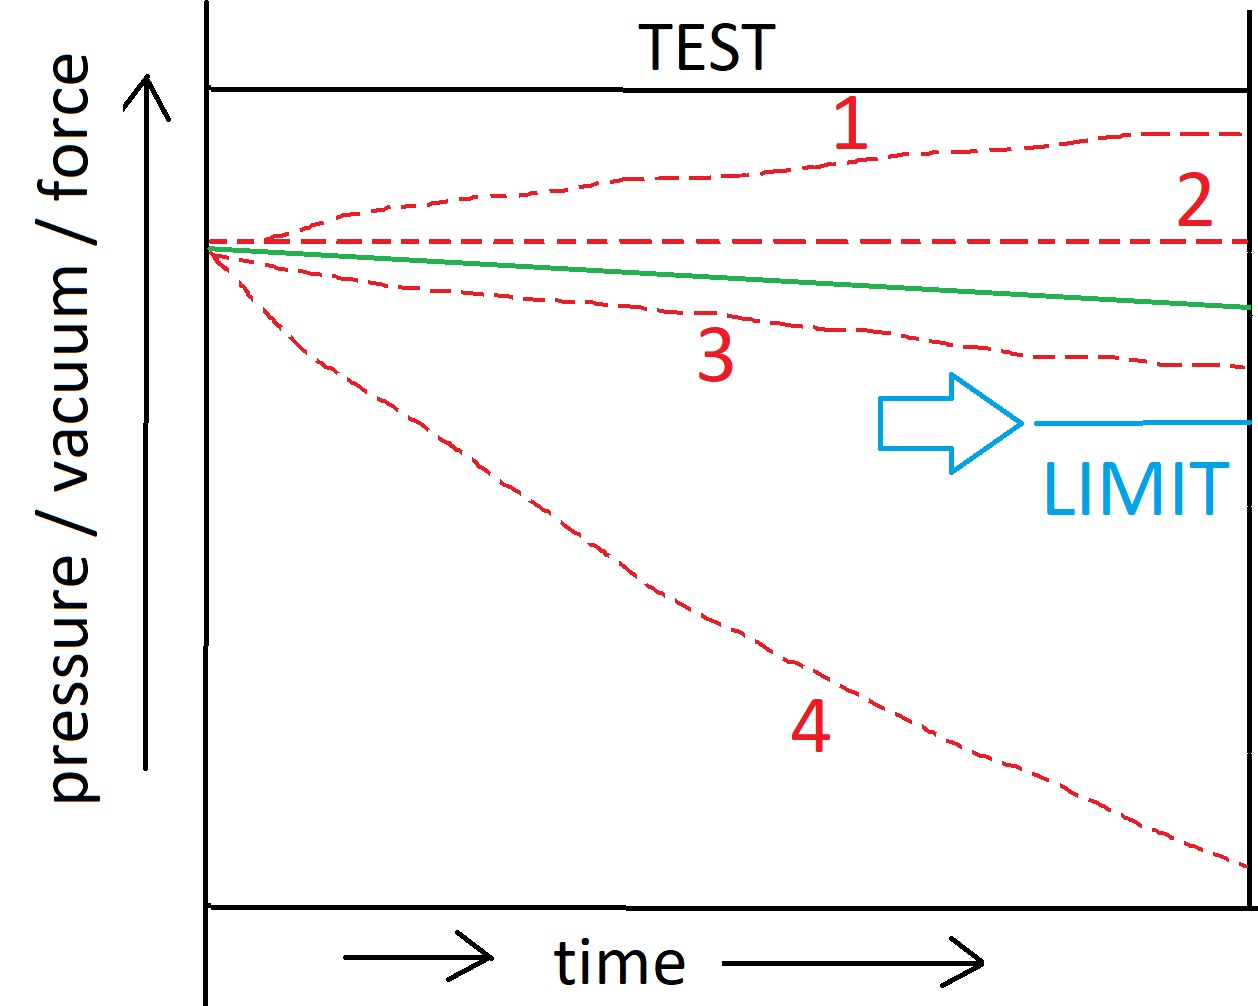
Test Phase
Good Curve (GREEN)
Your testing specimen is now fully inflated, and the test has begun. A good part will slowly decrease with a consistent slope. If the slope is within the specifications and above the lower limit, your test is a PASS.
Scenario 1: The Testing Slope increases
Most Likely Root Causes:
1. You have loaded the wrong recipe
2. Part not connected properly
3. Test did not run properly
Scenario 2: The Testing Slope Stays Flat
Most Likely Root Causes:
1. Test Sensor not recording leaks
2. You may have a good part
Scenario 3: The Testing Slope Decreases more than expected
Most Likely Root Causes:
1. The leak is larger than usual, but still above the limit. This is still a good part.
Scenario 4: The Filling Slope is Smaller
Most Likely Root Causes:
1. You have a micro leak and your part is a leaker
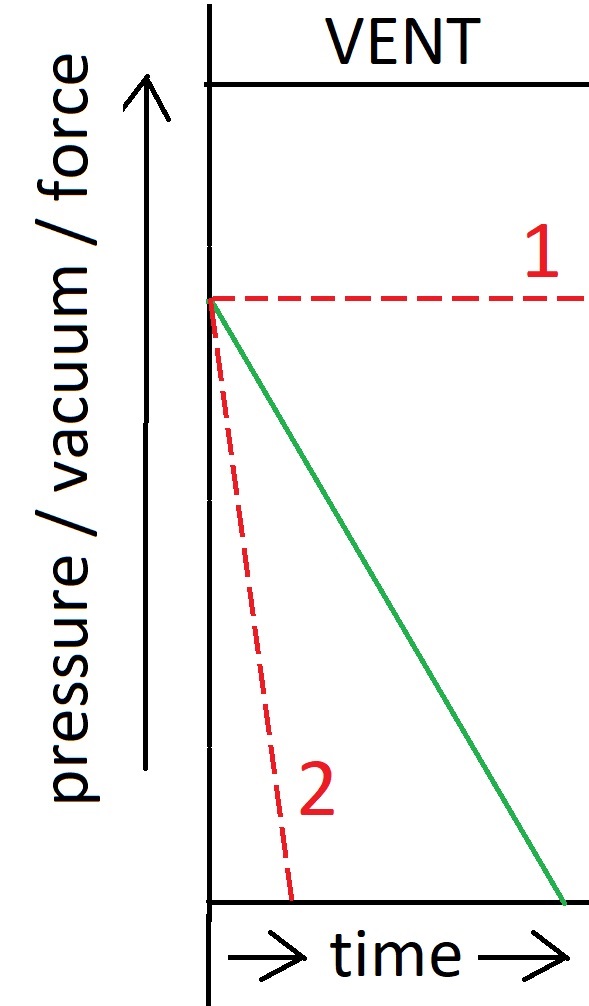
Vent Phase
Good Curve (GREEN)
During the venting phase the part will be returned to its initial form. A good part will return to its initial geometric form meaning that the test will have not altered the test specimen in any way. The venting slope is specific to the test specimen and should not vary.
Scenario 1: The venting curve is horizontal
Most Likely Root Causes:
1. Test specimen did not vent, venting valve did not open
Scenario 2: The venting curve is smaller than usual
Most Likely Root Causes:
1. The test may have altered the test specimen. You have a destructive test. The test may have even destroyed your part.
Conclusion
Well, there you have it; the anatomy of the Pressure, Vacuum, and Force Decay Test.
Thank you for taking the time to read our write up, if you have any questions or comments with regards to this article feel free to CONTACT US.
You may be interested in some of our other items
We are an Engineering Excellence Company. You should check out some of our other items we carry; click on the links below.